

Unlock Your Energy Potential: How a Renewable Energy Dashboard Transforms Power Management
Imagine having a crystal-clear window into the very heart of your energy ecosystem. For businesses and homeowners embracing solar panels, battery storage, and other renewable assets, this vision is now a reality thanks to a powerful tool: the renewable energy dashboard. This intelligent software interface is more than just a screen of numbers; it's the central nervous system for modern energy management, turning complex data into actionable insights and real savings. As grid instability and energy costs continue to challenge both European and American markets, gaining precise control over your power generation, storage, and consumption isn't just smart—it's essential. This article will guide you through how this technology works and the tangible benefits it delivers.
Table of Contents
- What is a Renewable Energy Dashboard?
- The Urgency: Why You Need One Now
- Key Features of an Advanced Dashboard
- A Real-World Case Study: Precision in Practice
- The Highjoule Approach: Intelligence Meets Hardware
- Future Trends: Where Dashboard Technology is Headed
What Exactly is a Renewable Energy Dashboard?
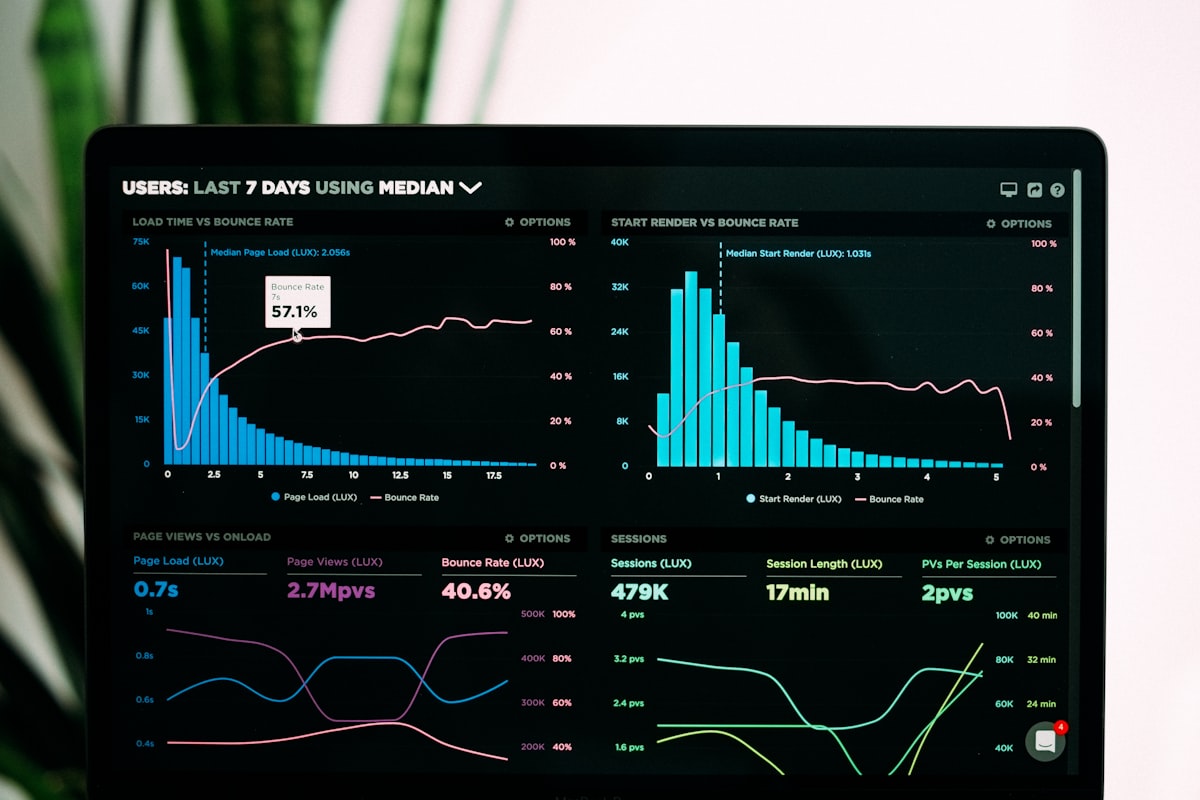
At its core, a renewable energy dashboard is a visual software platform that aggregates, monitors, and analyzes data from your distributed energy resources. Think of your solar PV array, battery storage system, grid connection, and building loads as individual musicians. The dashboard is the conductor, ensuring they all play in harmony. It pulls real-time and historical data from inverters, meters, and battery management systems, presenting it through intuitive charts, graphs, and alerts.
Gone are the days of manually checking inverter displays or sifting through monthly utility bills. A modern dashboard provides a unified, often cloud-based, view that answers critical questions: Is my solar system producing as expected? How much energy is my battery storing right now? What was my self-consumption rate yesterday? This transparency is the first step toward true energy intelligence.
The Urgency: Why You Need One Now
The shift to renewables is accelerating, but it introduces new complexities. The phenomenon is clear: energy systems are no longer one-way streets. You are both a consumer and a producer—a "prosumer." This duality creates a data deluge. Without a central point of command, you're flying blind.
Let's look at the data. According to the International Energy Agency (IEA), global renewable capacity additions soared by nearly 50% in 2023. In the U.S., the Solar Energy Industries Association (SEIA) reports that solar now powers over 5% of the nation's grid. In Europe, targets like the EU's REPowerEU plan are pushing solar and storage adoption at a breakneck pace. This rapid growth means millions of new energy assets are coming online, each generating streams of data. The challenge isn't just generating clean energy; it's orchestrating it efficiently. An advanced dashboard is the solution to this orchestration challenge, turning raw data into cost reduction, sustainability proof, and energy resilience.
The Consequences of "Dashboard Blindness"
- Financial Loss: Unoptimized systems may export excess solar energy at low rates only to import expensive grid power later.
- Performance Degradation: A minor fault in a solar string or battery module can go unnoticed for months, eroding returns.
- Missed Incentives: Failure to accurately track energy data can complicate participation in demand response programs or clean energy credits.
Key Features of an Advanced Renewable Energy Dashboard
Not all dashboards are created equal. A best-in-class platform, like those integrated into Highjoule's solutions, offers a suite of powerful features:
| Feature | Description | Direct Benefit |
|---|---|---|
| Real-Time Monitoring | Live view of generation, consumption, battery SoC (State of Charge), and grid flow. | Immediate awareness and anomaly detection. |
| Predictive Analytics & Forecasting | Uses weather data and historical patterns to predict solar yield and load. | Enables proactive battery scheduling for peak shaving. |
| Customizable Alerts & Reporting | Set alerts for system faults or performance drops. Generate compliance and sustainability reports automatically. | Reduces O&M costs and simplifies ESG reporting. |
| Energy Cost Management | Visualizes time-of-use rates and models the financial impact of different control strategies. | Maximizes ROI by automating decisions around the most expensive grid periods. |
A Real-World Case Study: Precision in Practice
Let's move from theory to practice with a concrete example from the commercial sector in Germany.
The Challenge: A mid-sized manufacturing plant in Bavaria had installed a 500 kWp rooftop solar system and a 250 kWh battery storage unit. Their goal was to reduce peak demand charges and increase self-sufficiency. However, they were managing their system with basic inverter software, lacking integration between solar, storage, and their high-energy machinery loads.
The Solution: The plant integrated a sophisticated renewable energy dashboard as part of a broader system upgrade. This platform provided:
- Second-by-second visibility into machine load profiles.
- AI-driven forecasting of production peaks.
- Automated control for the battery to discharge precisely during their 30-minute peak demand windows.
The Data-Backed Outcome: Within one quarter of operation, the dashboard's insights led to a 22% reduction in peak demand charges. Furthermore, by identifying suboptimal charging cycles, the system increased the plant's overall self-consumption of solar energy from 68% to 89%. The dashboard's reporting feature also auto-generated the necessary documentation for German renewable energy incentive programs (EEG), saving dozens of administrative hours annually. This case underscores that the right intelligence layer doesn't just monitor—it actively optimizes and pays for itself.
The Highjoule Approach: Intelligence Meets Hardware
At Highjoule, we believe a world-class renewable energy dashboard must be born from deep hardware expertise. Since 2005, we've understood that software intelligence is only as good as the physical systems it commands. That's why our Highjoule Energy Intelligence Platform is not an afterthought; it's the core of every system we design for commercial, industrial, and microgrid applications.
Our platform seamlessly unifies data from our high-efficiency battery storage systems, third-party solar inverters, and grid interfaces. For our clients, this means:
- Seamless Integration: A single pane of glass for all energy assets, eliminating vendor lock-in for monitoring.
- Prescriptive Insights: Moving beyond "what happened" to "what should I do?" with actionable recommendations for energy cost savings.
- Scalable Architecture: Whether you're managing a single facility or a distributed portfolio of sites across Europe or the U.S., our dashboard scales to provide both granular and fleet-wide views.

By coupling our hardware with this intelligent software layer, we ensure our clients extract every possible kilowatt-hour of value from their investment in sustainability.
Future Trends: Where Dashboard Technology is Headed
The evolution of the renewable energy dashboard is moving towards even greater autonomy and grid interaction. We are rapidly approaching the era of the "self-optimizing" energy system.
Emerging Capabilities to Watch:
- Peer-to-Peer (P2P) Energy Trading: Dashboards will soon manage local energy markets, allowing you to automatically sell excess solar power to your neighbor at a mutually beneficial price.
- Deep Grid Services Integration: Systems will automatically respond to grid frequency signals, providing stability services and creating new revenue streams for asset owners. The Federal Energy Regulatory Commission (FERC) in the U.S. has already paved the way for this through orders like FERC 2222.
- Enhanced Predictive Maintenance: Using machine learning, dashboards will predict equipment failures weeks in advance by analyzing subtle performance deviations, drastically reducing downtime.
Your System's Missing Piece?
If you have solar, storage, or are planning an installation, ask yourself: Is my current management approach reactive and fragmented? Are financial and sustainability outcomes being left on the table? The transition to smart, resilient power isn't complete with hardware alone. The true catalyst is the intelligence that binds it all together.
What could a 20% reduction in your peak demand charges or a 95% self-sufficiency rate do for your operational goals this year? The answer might already be in your data, waiting for the right dashboard to reveal it.
 Inquiry
 Online Chat